
How AI Predicts Football Matches: Inside SupaBola's Engine
The phrase "AI football predictions" gets thrown around a lot, often as a marketing term attached to what is, in reality, a basic statistical model or — worse — a human tipster with a rebrand. We think that's worth addressing directly.
This article explains what AI prediction actually means in practice, how SupaBola's engine works, and — honestly — where it performs well and where it doesn't. If you've wondered what separates a real predictive model from a fancy spreadsheet, this is for you.
How Predictions Were Made Before AI
Traditional football prediction relied on one of three approaches:
Human expert opinion. Pundits, analysts, and experienced bettors used pattern recognition built from years of watching football. This works — experienced observers can identify subtle signals — but it doesn't scale, it's inconsistent, and it carries heavy cognitive biases (recency bias, favourite team bias, reputation heuristics).
Simple statistical models. The Poisson distribution approach has been around since the 1980s. You take each team's average goals scored and conceded, adjust for home advantage, and use a mathematical formula to generate a scoreline probability matrix. This is better than pure opinion — it's systematic and reproducible — but it treats every goal as equivalent and ignores context entirely.
Odds copying. Some "prediction" services simply repackage bookmaker odds into percentage format. This isn't prediction — it's regurgitation. The bookmakers have already baked their margin in; you're not learning anything new.
The limitation all three approaches share: they either ignore most of the available data, or they can't process it fast enough to be useful at scale.
What Data Goes Into a Modern Prediction
SupaBola's engine processes data across five categories for every fixture:
1. Team Form and Results
The obvious starting point — but the implementation matters. Raw wins/losses/draws over the last five games are a poor signal. What matters more:
- Weighted recent form: matches from the last 6 weeks count more than matches from 6 months ago
- Quality-adjusted results: a 2-0 win against a relegation-threatened side is not the same signal as a 2-0 win against a Champions League qualifier
- Context stripping: cup matches, heavily rotated XIs, and dead rubbers are flagged and down-weighted appropriately
2. Expected Goals (xG)
xG is the most important single variable in the model for predicting future match outcomes — more predictive than actual goals scored. The reason: football is a low-scoring sport with significant luck in finishing and goalkeeping. A team that consistently creates 2.1 xG per game but is converting at 1.2 goals is likely to regress upward; a team scoring 2.0 goals from 0.9 xG is likely to regress downward.
We track both xG created and xG conceded per match, weighted over a rolling window of 10 competitive games. The differential — xGD — is the strongest single predictor of future outcomes in our validation testing across five European leagues.
3. Player-Level Metrics
Team-level stats miss a critical dimension: personnel. A team's expected performance changes meaningfully when key players are absent.
The model incorporates:
- Starter availability: injuries, suspensions, and confirmed absences
- Player impact ratings: position-specific metrics (progressive passes per 90, pressures per 90, aerial win rate, save percentage) that quantify how much each player affects outcomes
- Fatigue proxies: days since last match, minutes played in the last 21 days, travel burden for European fixtures
When a team's first-choice striker or central midfielder is ruled out, the model adjusts the probability estimate — typically 3-7% depending on the player's measured impact rating.
4. Market Odds as a Signal
This might seem counterintuitive — if we're building our own model, why use bookmaker odds as an input?
Because sharp bookmaker markets aggregate enormous amounts of information, including some signals we don't have access to. Professional bettors, insider team information, and sophisticated quantitative funds all flow into major markets. The resulting odds represent a collective intelligence that is often more accurate than any single model.
We use market odds as one input among many, not the primary signal. When our model diverges meaningfully from the market, we treat that as a hypothesis to test rather than an automatic trade.
5. Match Context
Two teams can have identical form and xG records but face very different situations:
- Home/away advantage: home advantage in top European leagues is worth approximately 0.35-0.45 goals in terms of xG differential
- Fixture congestion: teams playing their fourth match in 10 days show measurable performance decline in the data
- Competition stakes: teams mathematically eliminated from a competition or with a fixture in three days show different expected effort levels
How the Models Work: An Ensemble, Not a Single Algorithm
This is where most explanations go wrong by suggesting there's one AI "brain" making predictions. There isn't. A single model — however sophisticated — has failure modes. An ensemble approach reduces those failures.
SupaBola runs three prediction tiers, each with different strengths:
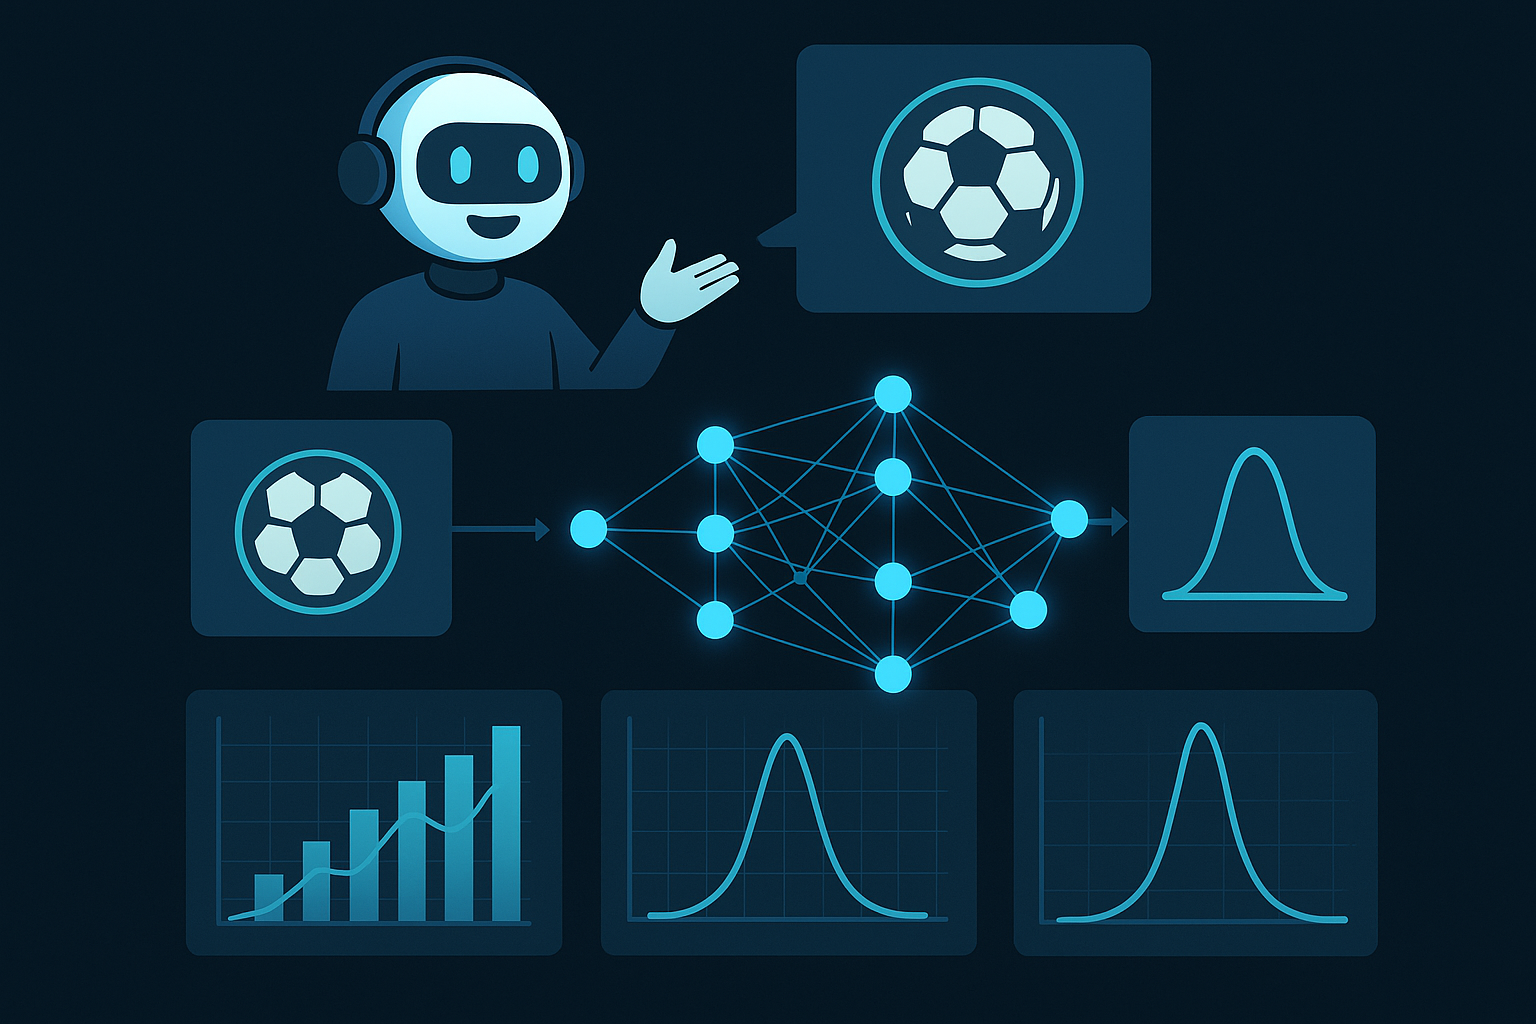
Tier 1: The Statistical Foundation
The baseline tier uses classical statistical approaches: Poisson distribution modelling, Elo rating systems, and regression-based form indices. These are fast, interpretable, and robust. They form the foundation of every prediction and are particularly reliable for matches between well-data-rich teams (top European leagues with 3-5 seasons of clean data).
Tier 1 outputs a win/draw/loss probability distribution and an expected scoreline range.
Tier 2: The Machine Learning Layer
The advanced tier processes over 11,800 data points per fixture using gradient-boosted tree models and neural networks trained on historical match data from 12 leagues across 8 seasons. This layer can detect non-linear patterns that the statistical models miss — for example, the specific combination of a defensive-minded away side with high pressing intensity against a possession-dominant home team tends to produce lower-scoring outcomes than the baseline models predict.
Tier 2 is where most of the value-add comes from for fixtures in data-rich leagues. It's also where the model's accuracy advantage over simple approaches is most pronounced. Our validation testing shows Tier 2 outperforms the Poisson baseline by 4-8% on log-loss metrics across Premier League, La Liga, and Bundesliga samples.
The honest caveat: Tier 2 is less reliable for international football, lower leagues, and teams with less historical data. For a World Cup qualifier between two CONCACAF sides with limited recent data, the model reverts toward baseline estimates with wider confidence intervals.
Tier 3: Coach Bola
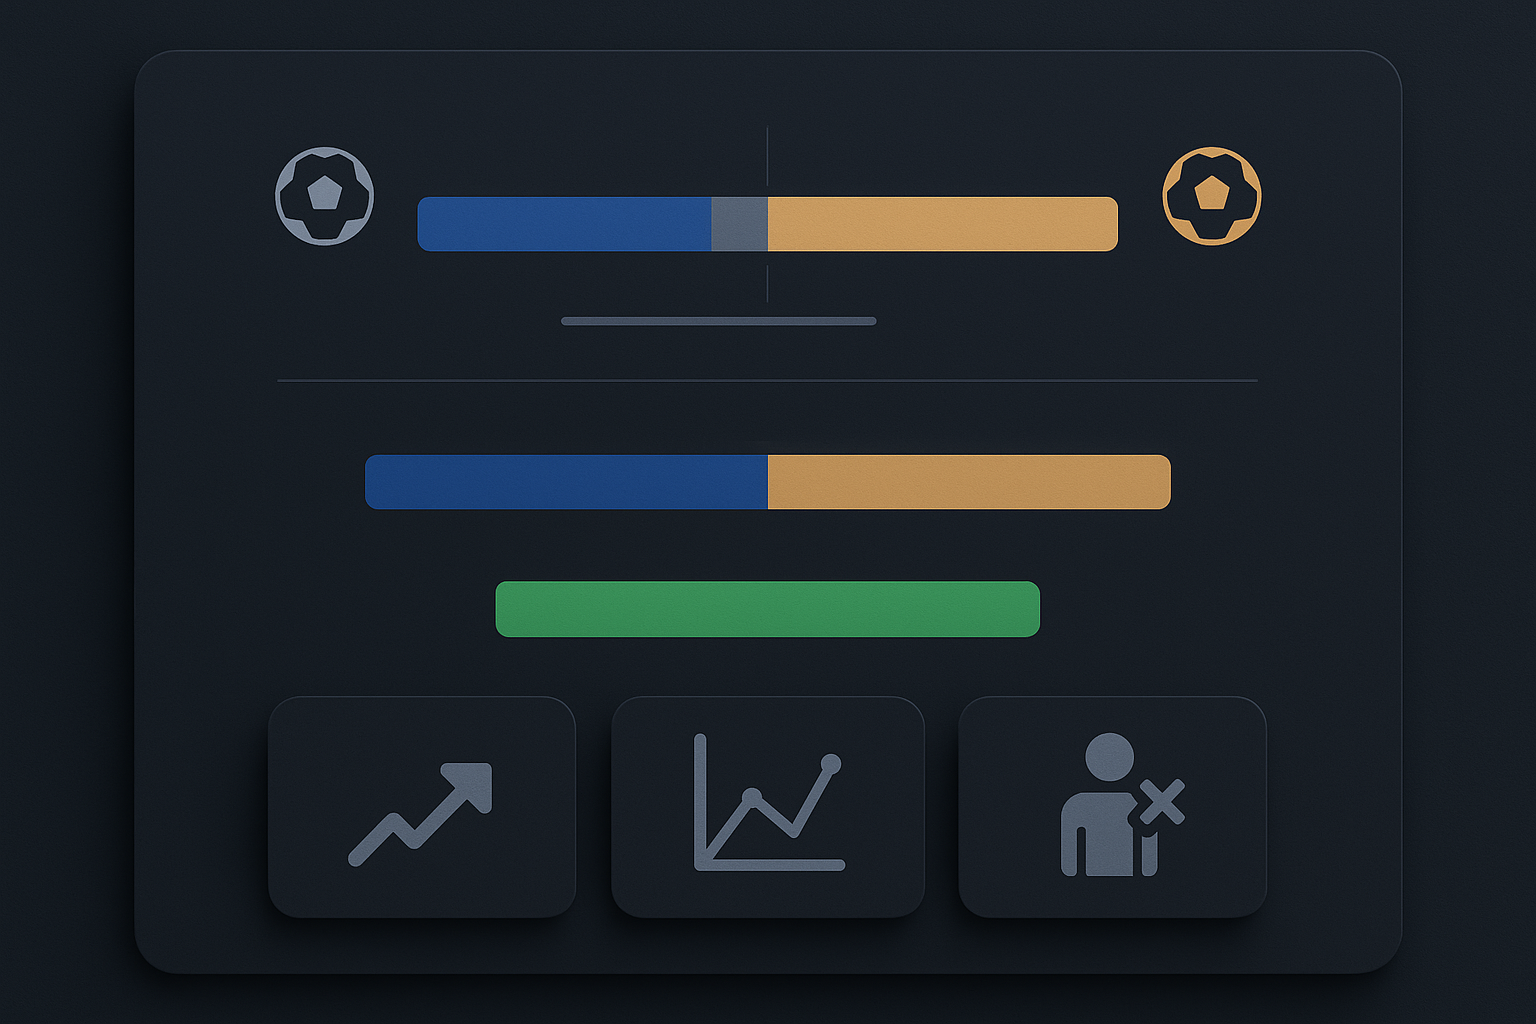
Coach Bola is SupaBola's interpretive layer — the part of the system that turns raw model outputs into plain-language guidance for bettors.
Coach Bola doesn't generate predictions from scratch. It synthesises the outputs from Tiers 1 and 2, cross-references them against current market odds, identifies where the model's probability estimates diverge from the market (potential value bets), and explains the key factors driving each prediction in language that doesn't require a statistics degree to understand.
A typical Coach Bola output for a fixture might say: "Our model rates the home side's win probability at 58%, higher than the market's implied 49%. The gap is driven primarily by the away side's poor xG in the last five away games (0.7 average) and the home team's strong defensive record since their manager switched to a back-five. This is flagged as a potential value opportunity."
Coach Bola is also honest about confidence. When the model's two tiers disagree significantly, or when data coverage is limited, it says so — rather than presenting false certainty.
Accuracy and Transparency
This section matters, because claims about prediction accuracy are where the industry is most misleading.
Any model that claims to correctly predict football match outcomes at high rates (above 55-60%) on a consistent basis should be treated with scepticism. Football is a low-information, high-variance sport. Even the best models in the world operate with significant uncertainty because a single goal can swing a match that the underlying play didn't justify.
What SupaBola's model is actually good at:
- Probability calibration: when we say a team has a 65% chance of winning, they should win approximately 65% of the time. Our calibration on Premier League matches over the last 24 months shows the model is within 2-3 percentage points of actual outcomes across probability buckets.
- Identifying market inefficiencies: our Tier 2 model identifies fixtures where the bookmaker odds imply a meaningfully different probability than our estimate. These gaps are where value betting opportunities exist.
- Outlier detection: matches where the model sees much higher or lower probability than consensus are valuable signals, even when they're wrong — because over enough examples, they should be right more often than a random bet.
What the model is not:
- A guaranteed profit machine
- Accurate for every individual match
- Reliable without sufficient historical data on both teams
Key Takeaways
- AI prediction is not tipster rebranding — a genuine model processes structured data at scale, producing calibrated probability estimates rather than gut-feel picks dressed up in technical language.
- xG (expected goals) is the most predictive single variable for future match outcomes, more reliable than actual goals scored because it strips out finishing luck and goalkeeping variance.
- An ensemble approach outperforms any single model — SupaBola runs three tiers (statistical foundation, machine learning layer, and Coach Bola interpretation) because different approaches have different strengths and failure modes.
- Bookmaker odds are an input, not the output — sharp markets aggregate information that no single model can replicate, so using them as one signal among many improves calibration rather than undermining it.
- Confidence intervals matter — model accuracy is meaningfully higher for data-rich leagues (Premier League, La Liga, Bundesliga) than for lower divisions or international fixtures with limited historical data. Treat predictions accordingly.
- The goal is probability calibration, not picking winners — when the model says 65%, it should be right 65% of the time. That's the standard to hold any AI prediction tool to, and the one SupaBola publishes against.
- Value comes from the gap between model and market, not from prediction accuracy alone. A model that's right 55% of the time on bets the market prices at 45% is profitable. One that's right 60% on bets the market prices at 62% is not.
Why This Matters for Bettors
The practical value of a well-calibrated AI model isn't in picking winners — any punter can do that. It's in quantifying how wrong the bookmaker might be.
Bookmakers price markets to make profit, not to reflect true probabilities. Their margins (the vig) ensure that if you bet randomly, you lose money over time. To beat that margin consistently, you need a probability estimate that is systematically more accurate than the market on specific match types.
Our value bets page shows, in real time, the matches where our model's estimated probability diverges from the current market by enough to potentially represent positive expected value. We don't tell you what to bet — we show you where the data suggests the market may be wrong, and by how much.
The deeper your understanding of how the model works and where it's reliable versus uncertain, the better you can use these signals. A value bet flagged in the Premier League with 8 seasons of xG data behind it is a different proposition from one flagged in a lower-league international fixture with limited data.
Using AI Predictions as a Bettor in Southeast Asia
The betting landscape in Southeast Asia presents both a specific advantage and a specific challenge when using AI-driven probability models.
The advantage: Southeast Asian markets — particularly those operating in the Thai, Indonesian, and Malaysian regions — are often slower to sharpen lines on European leagues compared with sharp European markets. When a Premier League fixture kicks off at 1 AM Bangkok time, the Asian market odds can lag 15-30 minutes behind where sharp money has already moved the European exchanges. A model that has done its work beforehand gives you a reference point for whether the line you're seeing represents value or noise.
The challenge: the data ecosystem for Southeast Asian domestic leagues — Thai Premier League, Indonesian Liga 1, Vietnam's V.League, Philippines Football League — is thinner than for European competitions. Historical xG data, lineup databases, and player-level metrics are patchier. SupaBola's Tier 2 model is currently trained primarily on European and top South American data, which means predictions for domestic SEA fixtures carry wider confidence intervals than equivalent Premier League outputs.
Our recommendation for bettors in the region:
- For European leagues: Use SupaBola's value bets and predictions as a full data source. The model's coverage of Premier League, La Liga, Bundesliga, Serie A, and Ligue 1 is deep enough to support value-bet identification with meaningful confidence.
- For Asian handicap markets: The model outputs work well alongside AH markets because they remove the draw variable — which is one of the highest-variance outcomes in the model. When Coach Bola flags a home side's win probability at 65%+, the implied Asian handicap direction is usually consistent.
- For SEA domestic leagues: Treat model outputs as a starting point rather than a definitive edge. Combine them with local knowledge — squad rotation patterns, domestic season pressure, cup fixture timing — that may not be fully captured in the underlying data.
The broader point: a well-calibrated probability model doesn't need to be perfect to be useful. If it gives you a better estimate than the bookmaker's implied probability on enough fixtures, the edge compounds. In Southeast Asian markets, where lines move more slowly and sharp-money adjustment is less immediate, there is more opportunity for a model-derived edge to exist before the market catches up.
The Limits of Any Model
We want to be direct about this, because the betting industry rarely is.
No model — including ours — can account for:
- Last-minute team news that hasn't been publicly confirmed
- In-match tactical shifts that alter expected outcomes
- Match-fixing (which, while rare at top-level football, exists)
- Weather and pitch conditions beyond basic surface type
- The inherent randomness of football — where a deflected cross or a refereeing decision can determine a result that 1,000 simulations would have resolved differently
We account for many of these factors partially — confirmed team news, weather proxies, referee statistics. But the honest reality is that a football match is a complex, chaotic system. The model's job is to give you a probability estimate that is better than the market's on average, not to be correct about any single outcome.
Over many bets, better probability estimates produce better long-term returns. Over one bet, anything can happen.
Explore the Predictions
SupaBola's predictions page gives you access to the model's outputs for every upcoming fixture across major leagues and international competitions. Each prediction shows the win/draw/loss probability, the model's confidence level, and the key factors driving the estimate.
The analytics section goes deeper — showing xG trends, form trajectories, and head-to-head historical data for any fixture in our database.
For bettors new to probability-based approaches, our learning centre covers expected value, Kelly Criterion for stake sizing, and how to use data to find genuine betting edges rather than just picking winners.
And if you haven't read our value betting explainer, that's the right place to start — it explains the core concept that makes all of this data actually useful in practice.
For educational and informational purposes only. SupaBola's models provide probability estimates, not guaranteed outcomes. Not gambling advice. Please gamble responsibly.